

Inflation Calculator
Discover how inflation impacts your purchasing power. Use our free Inflation Calculator to track historical CPI rates and adjust money values over time.
Input Data
There was an error with your calculation.
How Inflation Erodes Purchasing Power and How to Measure It
Last updated: July 17, 2026
Table of Contents
- Definition of Inflation
- Deflation
- Hyperinflation
- Reasons for Inflation
- How to Calculate Inflation
- Formulas Used to Calculate Inflation
- Difference Between Forward Flat Rate and Backward Flat Rate Inflation Calculators
- Methods for Governments to Regulate Inflation
- Devastating Inflation Examples in History
- Practical Examples of Using an Inflation Calculator
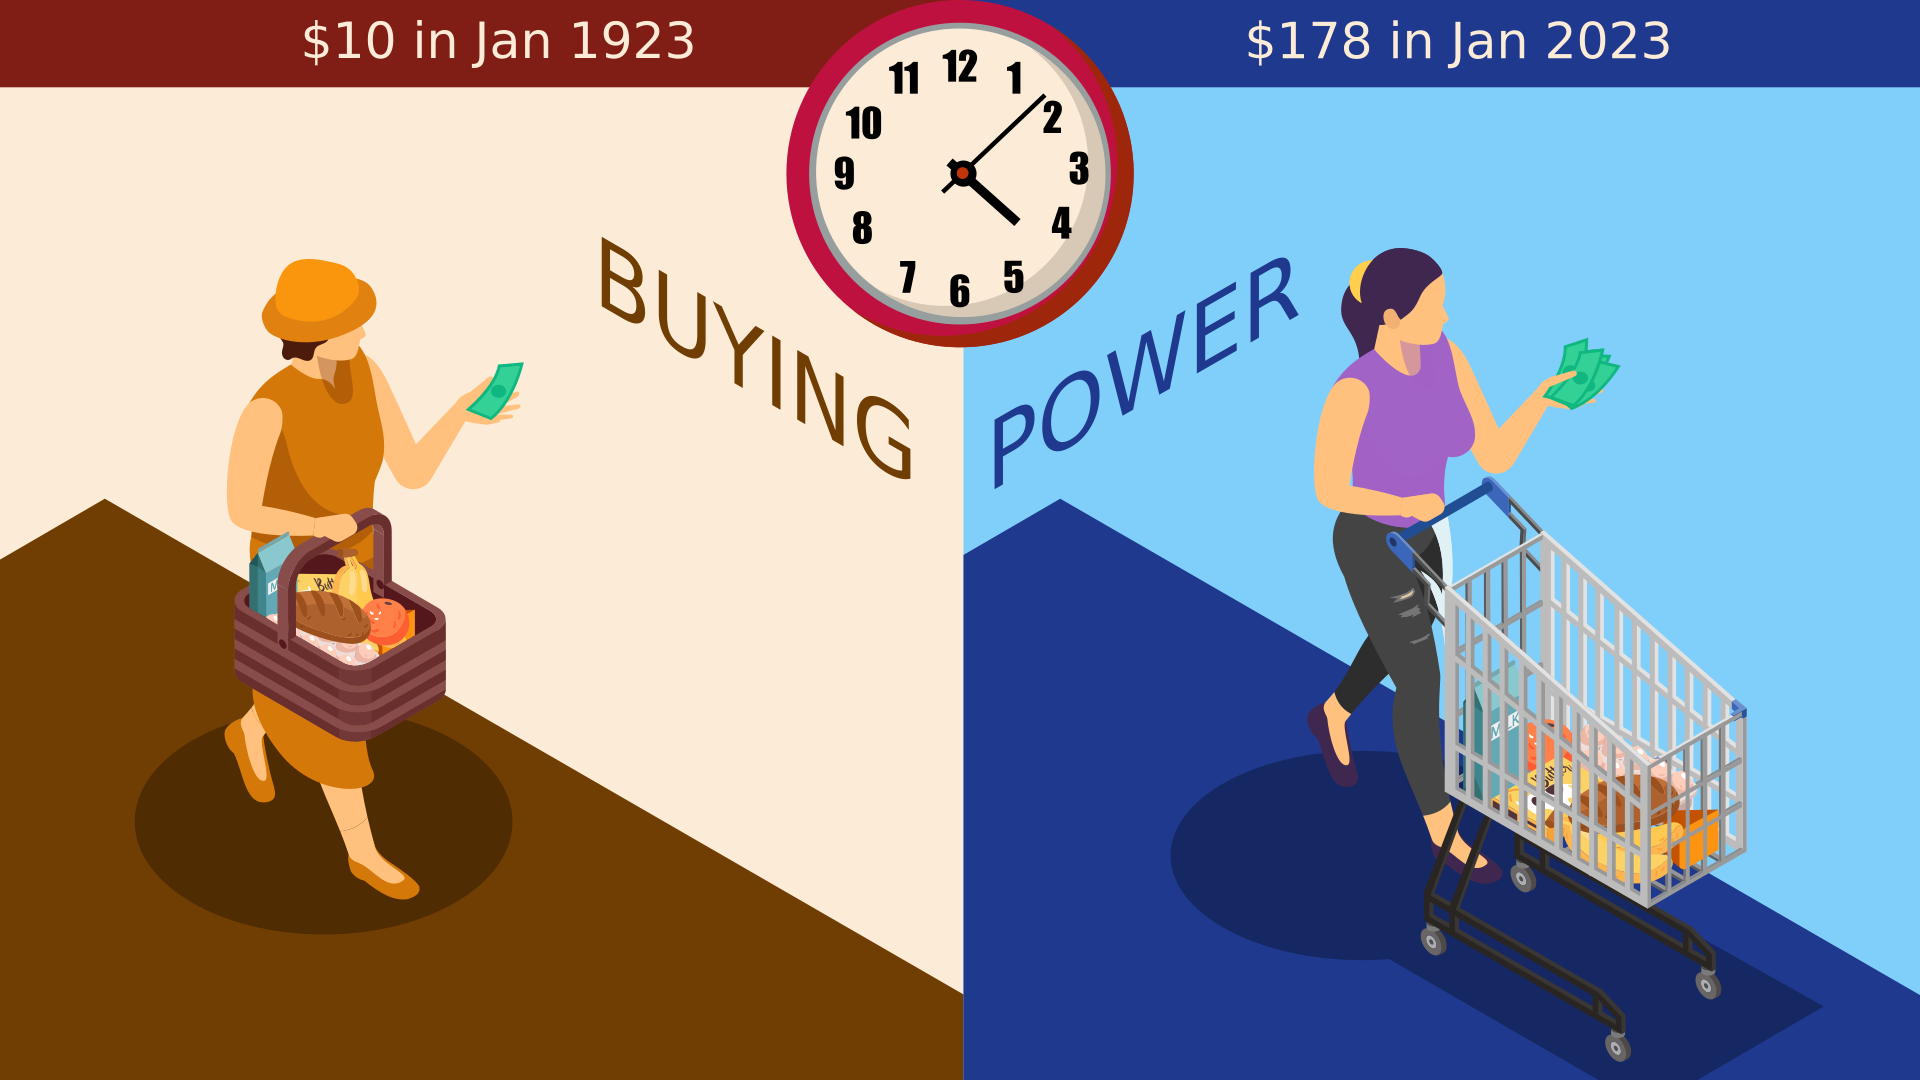
Are you concerned about the rising cost of goods and services? Our inflation calculator uses historical CPI (Consumer Price Index) data from the United States to measure how the purchasing power of the U.S. dollar has changed over time.
Using our CPI calculator is simple: just enter a dollar amount, the original year, and the target year for the adjusted rate. Depending on your financial planning needs, you can also use our Backward Flat Rate Inflation Calculator or Forward Flat Rate Inflation Calculator. These advanced options allow you to model theoretical scenarios, helping you determine how interest rates and a specific inflation rate will impact your future purchasing power. Historically, U.S. inflation has averaged roughly 3% per year, though the actual rate varies year to year—so you can easily adjust this percentage to fit current conditions and your custom calculations.
Definition of Inflation
Inflation represents the broad rise in the cost of goods and services across an economy, which over time translates to a decrease in purchasing power. The rate at which your money loses value is generally reflected by tracking the rising costs of a specific basket of goods and services over a set period.
This price increase is typically expressed as a percentage, meaning a specific currency can purchase fewer items today than it could in the past. Simply put, inflation is the exact opposite of deflation.
Deflation
Deflation occurs when consumer prices drop and purchasing power increases over a specific period. In a deflationary environment, the money you have today will buy more goods and services tomorrow.
While deflation might sound appealing at first glance, economists historically view it as a warning sign of impending economic hardship or recession. When consumers expect prices to continue falling, they often delay major purchases in hopes of securing a better deal later. This reduction in consumer spending leads to lower business revenues, which can ultimately trigger higher interest rates and widespread unemployment.
Hyperinflation
When discussing changes in purchasing power, it is crucial to understand hyperinflation. This extreme economic scenario happens when a country experiences a rapid, excessive, and out-of-control surge in general prices. While standard inflation refers to a gradual pace of rising costs, hyperinflation is typically defined as an inflation rate that exceeds 50% in a single month.
Fortunately, hyperinflation is extremely rare in developed economies. However, nations such as Germany, Russia, and China have all experienced devastating bouts of hyperinflation at various points in modern history.
Reasons for Inflation
Fundamentally, inflation is driven by shifts in supply and demand. Many economists argue that demand-side pressures are the primary catalyst for short-term inflationary spikes.
The two main causes of inflation include:
- Cost-push inflation occurs when overall prices rise due to a sudden decrease in supply or more expensive production costs (such as raw materials and wages).
- Demand-pull inflation happens when the aggregate demand for goods and services outpaces the available supply, driving prices up across the entire economy.
However, these are not the only triggers. Monetarist economists emphasize that an increase in the overall money supply in circulation can directly lead to inflation—after all, when there is an abundance of a currency, its market value inherently decreases. Additionally, two other major external influences can elevate inflation risks:
Fiscal Policy
When governments adopt an expansionary fiscal policy—characterized by increased government spending, decreased tax revenues, or a combination of both—consumers typically have more disposable income to spend on goods and services. If this surge in consumer spending is coupled with massive government investments in infrastructure, the resulting spike in aggregate demand ultimately leads to higher prices.
Housing Market
The real estate sector is highly cyclical and has seen many ups and downs over the years. When a thriving economy drives up the demand for housing, property prices inevitably rise. This surge doesn't happen in a vacuum; it impacts a wide array of ancillary products and services tied to the U.S. housing market. Increased demand drives up the cost of raw building materials like steel, lumber, rivets, nails, and anything else utilized in domestic construction.
How to Calculate Inflation
In the United States, economists and policymakers rely on two primary indexes to calculate the national inflation rate: the Personal Consumption Expenditures (PCE) Price Index and the Consumer Price Index (CPI).
Because these two inflation metrics utilize different methodologies, let's explore each one in more detail:
Consumer Price Index Inflation
CPI inflation is calculated by the Bureau of Labor Statistics (BLS). The BLS collects extensive data from millions of U.S. consumers to track the price fluctuations of a representative basket of goods and services. Everyday expenses—such as prescription drugs, food, computers, mortgage payments, college tuition, and gasoline—are tracked to determine how much their costs have changed over time.
Because two specific categories—food and energy—experience higher volatility than others due to seasonal demand and global supply chain disruptions, the BLS also measures "core inflation." Core inflation strips out these volatile food and energy prices from the formula to provide a clearer picture of underlying economic trends.
Calculating CPI Inflation
CPI inflation rates are found by calculating the weighted average cost of a standard basket of goods and services for a given month, and then dividing it by the cost of that exact same basket from the previous period. The pricing data relies heavily on detailed expenditure surveys that assess what real consumers are actively buying.
Personal Consumption Expenditures Inflation
PCE inflation is determined by the Bureau of Economic Analysis (BEA). Like the CPI, the PCE formula tracks price changes across a basket of goods and services. However, the primary difference lies in the data source: PCE metrics are derived from comprehensive data gathered directly from corporate sales reports rather than consumer surveys.
While the difference might seem minor, the PCE better captures expenditures made on behalf of consumers, such as employer-sponsored medical care. Another critical distinction is that the PCE is designed to account for "substitution effects" when prices fluctuate. For instance, if economic times are tough and beef prices skyrocket, consumers might switch to buying cheaper chicken. The PCE formula adapts to these shifts in consumer behavior, whereas the rigid CPI formula has no way of tracking this data.
Formulas Used to Calculate Inflation
You can easily determine the changing value of money using a free online inflation rate calculator, or you can calculate it manually using the standard inflation formula:
$$Inflation\ Rate = \frac{B - A}{A} × 100$$
Where A is the starting cost and B is the ending cost
Looking at the inflation equation above, A represents the starting price (based on historical CPI data) for a specific good or service during a past month or year. B represents the current CPI price for that exact same product or service.
Using this formula is straightforward. Here are the step-by-step instructions to calculate inflation:
- Subtract the starting price from the current price to determine the absolute change in price.
- Divide the result by your starting price, which will yield a decimal figure.
- Multiply the decimal by 100 to convert it into a standard percentage rate; this is your final answer.
Difference Between Forward Flat Rate and Backward Flat Rate Inflation Calculators
If you prefer using an automated inflation rate calculator, you have several powerful options depending on your specific financial modeling goals.
The first option is the historical inflation calculator that uses raw CPI data. This is the absolute best option for comparing the true purchasing power of past dollars to today's currency. For example, if you want to know the modern equivalent of having $1,500 in the year 2010, this tool provides the exact inflation-adjusted figure.
The next option is the Forward Flat Rate Inflation Calculator. This tool projects future inflation based on a specific average percentage rate over a set number of years. For instance, if you assume a steady 3% annual inflation rate, this calculator will tell you exactly what $1,000 will be worth ten years from now.
Finally, there is the Backward Flat Rate Inflation Calculator. This is an excellent tool for historical buying power comparisons based on a fixed average inflation rate rather than exact CPI data. For example, you could determine what $1,000 would have been worth a decade ago if the average annual inflation rate had sat perfectly at two percent.
Methods for Governments to Regulate Inflation
Historically, inflation is managed by a nation's government and its central bank. While monetary policy is the primary tool used to manipulate inflation, governments deploy several strategies to regulate economic stability and curb rising costs.
- Monetary Policy: By raising interest rates, central banks make borrowing more expensive. This naturally cools down consumer demand, leading to slower economic growth and reduced inflation.
- Fiscal Policy: Governments can increase income tax rates or cut public spending to reduce disposable income, thereby lowering aggregate demand and mitigating inflationary pressures.
- Control of Money Supply: Monetarists argue that a direct correlation exists between inflation and the circulating money supply. Tightly regulating how much money is printed and circulated helps keep inflation in check.
- Wage/price Controls: In theory, implementing strict legal caps on wages and consumer prices can halt inflation. However, economists widely view price controls as ineffective, as they frequently lead to severe product shortages and black markets.
- Supply-side Policy: Governments can enact policies designed to boost efficiency and competitiveness in the market, which naturally drives down the cost of goods and services over the long term.
Devastating Inflation Examples in History
Numerous global economies have suffered crippling bouts of hyperinflation over the past century. Here are a few prominent historical examples:
Hungary, 1945 - 1946
In the aftermath of World War II, Hungarian policymakers essentially weaponized hyperinflation to restart their devastated economy. They used hyperinflation as an invisible citizen tax to fulfill massive war reparations and regular payments to the USSR. At its absolute peak, Hungary's daily inflation rate reached a staggering 207%.
Yugoslavia, 1992-1994
Following the geopolitical collapse of Yugoslavia, inter-regional trade networks were completely disassembled, decimating local production industries. As the wars in Bosnia and Croatia intensified, the Yugoslav government refused to slash bureaucratic spending, instead printing vast sums of money. At its height, the daily inflation rate hit 64.6%, peaking at an unimaginable 313,000,000% in a single month.
Zimbabwe, 2007 - 2008
A highly publicized modern example of economic collapse occurred in Zimbabwe between 2007 and 2008. The nation's financial system had been deteriorating for years—hitting a 47% annual inflation rate back in 1998—before spiraling entirely out of control. By the end of this hyperinflationary period in 2008, the purchasing power of the Zimbabwean dollar was so severely eroded that the government abandoned it entirely, replacing it with a basket of foreign currencies.
Practical Examples of Using an Inflation Calculator
There are numerous practical applications for a CPI inflation calculator in everyday financial planning.
-
You can use an inflation calculator to track the inflation rate of a gallon of milk from 1995 to 2020. According to historical CPI data, a gallon of milk cost an average of $2.52 in 1995 and rose to $3.20 by 2020. By plugging these numbers into the inflation formula provided above, you will find that the total inflation rate for a gallon of milk over that 25-year period was approximately 27%.
-
Another example is calculating the inflation rate of bananas between 2001 and 2014. First, you need the price of bananas in 2001, which averaged $0.52 per pound. Next, you check the price in 2014, which climbed to $0.59 per pound. Using the standard formula, you can determine that the price of bananas experienced a total inflation rate of 13.46% during this timeframe.