No results found
We can’t find anything with that term at the moment, try searching something else.
Probability Calculator
The probability calculator can find two events' probability and the normal distribution probability. Learn more about probability's laws and calculations.
| Result | ||
|---|---|---|
| Probability of A NOT occuring: P(A') | 0.5 | |
| Probability of B NOT occuring: P(B') | 0.6 | |
| Probability of A and B both occuring: P(A∩B) | 0.2 | |
| Probability that A or B or both occur: P(A∪B) | 0.7 | |
| Probability that A or B occurs but NOT both: P(AΔB) | 0.5 | |
| Probability of neither A nor B occuring: P((A∪B)') | 0.3 | |
| Probability of A occuring but NOT B: | 0.3 | |
| Probability of B occuring but NOT A: | 0.2 | |
Probability
Probability of A: P(A) = 0.5
Probability of B: P(B) = 0.4
Probability of A NOT occuring: P(A') = 1 - P(A) = 0.5
Probability of B NOT occuring: P(B') = 1 - P(B) = 0.6
Probability of A and B both occuring: P(A∩B) = P(A) × P(B) = 0.2
Probability that A or B or both occur: P(A∪B) = P(A) + P(B) - P(A∩B) = 0.7
Probability that A or B occurs but NOT both: P(AΔB) = P(A) + P(B) - 2P(A∩B) = 0.5
Probability of neither A nor B occuring: P((A∪B)') = 1 - P(A∪B) = 0.3
Probability of A occuring but NOT B: P(A) × (1 - P(B)) = 0.3
Probability of B occuring but NOT A: (1 - P(A)) × P(B) = 0.2
Probability
Probability of A occuring 5 time(s) = 0.65 = 0.07776
Probability of A NOT occuring = (1-0.6)5 = 0.01024
Probability of A occuring = 1-(1-0.6)5 = 0.98976
Probability of B occuring 3 time(s) = 0.33 = 0.027
Probability of B NOT occuring = (1-0.3)3 = 0.343
Probability of B occuring = 1-(1-0.3)3 = 0.657
Probability of A occuring 5 time(s) and B occuring 3 time(s) = 0.65 × 0.33 = 0.00209952
Probability of neither A nor B occuring = (1-0.6)5 × (1-0.3)3 = 0.00351232
Probability of both A and B occuring = (1-(1-0.6)5) × (1-(1-0.3)3) = 0.65027232
Probability of A occuring 5 times but not B = 0.65 × (1-0.3)3 = 0.02667168
Probability of B occuring 3 times but not A = (1-0.6)5 × 0.33 = 2.7648e-4
Probability of A occuring but not B = (1-(1-0.6)5) × (1-0.3)3 = 0.33948768
Probability of B occuring but not A = (1-0.6)5 × (1-(1-0.3)3) = 0.00672768
Probability
The probability between -1 and 1 is 0.68268
The probability outside of -1 and 1 is 0.31732
The probability of -1 or less (≤-1) is 0.15866
The probability of 1 or more (≥1) is 0.15866
| CONFIDENCE INTERVALS TABLE | ||
|---|---|---|
| CONFIDENCE | RANGE | N |
| 0.6828 | -1.00000 – 1.00000 | 1 |
| 0.8 | -1.28155 – 1.28155 | 1.281551565545 |
| 0.9 | -1.64485 – 1.64485 | 1.644853626951 |
| 0.95 | -1.95996 – 1.95996 | 1.959963984540 |
| 0.98 | -2.32635 – 2.32635 | 2.326347874041 |
| 0.99 | -2.57583 – 2.57583 | 2.575829303549 |
| 0.995 | -2.80703 – 2.80703 | 2.807033768344 |
| 0.998 | -3.09023 – 3.09023 | 3.090232306168 |
| 0.999 | -3.29053 – 3.29053 | 3.290526731492 |
| 0.9999 | -3.89059 – 3.89059 | 3.890591886413 |
| 0.99999 | -4.41717 – 4.41717 | 4.417173413469 |
There was an error with your calculation.
Table of Contents
- Probability of Two Events Calculator
- Probability Solver for Two Events
- Probability of a Series of Independent Events
- Probability of a Normal Distribution
- Introduction to Probability
- Rules of event operations
- Example
- Complement an event
- Intersection of events
- Independent Events
- Union of events
- Normal distribution
- Probability of normal distribution
- Example

Probability of Two Events Calculator
When you know the probability of two independent events, you can use the Probability of Two Events Calculator to determine their occurring together. You have to enter the probabilities of two independent events as the probability of a and b in the calculator. Then the calculator will show the union, intersection, and other related probabilities of two independent events along with the Venn diagrams.
Probability Solver for Two Events
You can compute the probability of various events of two independent events if you know any two input values of the Probability Solver for Two Events Calculator. This is important when you do not have one or both probabilities of two events. The results will show the answer with the calculation steps.
Probability of a Series of Independent Events
You can use the Probability of a Series of Independent Events Calculator to determine the probability of when each experiment contains two independent events that happen one after the other. In this calculator, you must set the number of times the event occurs.
Probability of a Normal Distribution
The normal distribution probability calculator is helpful when determining the probability of a normal curve. You must insert the mean μ, standard deviation σ, and boundaries. The normal probability calculator will generate the probability of the set boundaries and the confidence intervals for a range of confidence levels.
Introduction to Probability
Probability is the chance that an event will happen. When an event is unquestionably going to happen, its probability is 1. When an event is not going to happen, its probability is 0. As a result, a given event's probability is always between 0 and 1. The probability calculator makes calculating probabilities for various events incredibly simple.
Rules of event operations
Any grouping of an experiment's results is referred to as an event. It is an event that can be any subset of the sample space. The complement, intersection, and union can be identified as rules of event operations. Let's learn each of these rules using the below example.
Example
Your college has various faculties, including business faculty. International students are also enrolled in this college. You must conduct interviews with your college students as part of your project. You choose to begin with the first student who walks through the gate. You are aware of the following probabilities. Let's say,
A = The first student is from the Business Faculty.
B = The first student is an international student.
P(A) = 0.6
P(B) = 0.3
Complement an event
The complement of an event is the set of all outcomes in a sample space that are not included in that event.
For example, the complement of event A means the first student is from somewhere other than the business faculty. This can be denoted by \$A\prime\$ or Aᶜ.
Let's show the complement of event A in a Venn diagram.
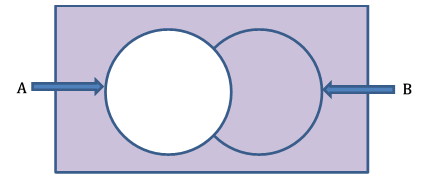
In the above Venn diagram, the colored area represents the complement of event A.
The rectangle's total area represents the overall probability of the sample space. It is precisely one. The space outside circle A shows the probability of the complement of event A. The Venn diagram allows us to establish the following relationship:
$$P\left(A\right)+P\left(A^\prime\right)=1$$
Therefore,
$$P\left(A^\prime\right)=1-P\left(A\right)$$
Let's find the following probabilities.
The probability of the first student you are selecting for the interview is not from the business faculty:
$$P\left(A^\prime\right)=1-P\left(A\right)=1-0.6=0.4$$
The probability of the first student you select for the interview is not an international student:
$$P\left(B^\prime\right)=1-P\left(B\right)=1-0.3=0.7$$
Intersection of events
The intersection of two events A and B is the list of all common elements in both events A and B. The word "AND" is frequently used to indicate the intersection of two sets.
The intersection of event A and event B in example 1 means selecting an international student, and the student is from the business faculty. This can be denoted as follows:
$$A\cap B$$
Let's show the intersection of events A and B in a Venn diagram.
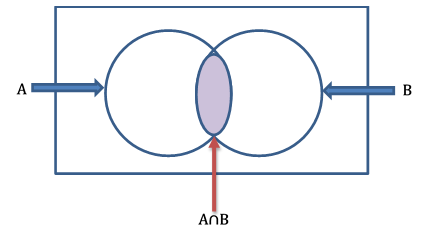
In the above Venn diagram, the colored area represents the intersection of events A and B.
Let's say the event of selecting a local student for the interview is C. Now, we will show events A and C in a Venn diagram.
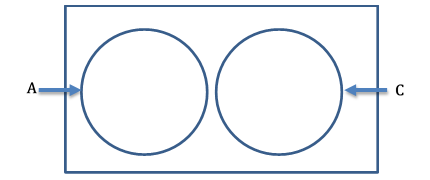
Selecting an international student and a local student cannot be done simultaneously. Suppose the first student you choose is an international student. In that case, it excludes the event of the first student being a local student. Therefore, events A and C are mutually exclusive events.
The mutually exclusive events do not have any common elements between them. Therefore, the intersection of two mutually exclusive events is empty.
$$A\cap C=φ$$
The probability of events' intersection can be calculated with different methods. Events A and B can be written as follows.
$$P\left(A\cap B\right)=P\left(A\right)+P\left(B\right)-P\left(A\cup B\right)$$
$$P\left(A\cap B\right)=P(A)× P(B/A)$$
$$P\left(A\cap B\right)=P(B)× P(A/B)$$
Independent Events
Independent events are events that do not influence one another. In our example, selecting a student from the business faculty does not affect choosing an international student or not. Therefore, we can say that event A and event B are two independent events.
When events are independent, the probability of any one of them happening does not depend upon that of the other. Therefore,
$$P(B/A)=B\ and\ P(A/B)=A$$
You can use these formulas to modify the formula we previously learned to determine the probability of two intersection events.
$$P\left(A\cap B\right)=P\left(A\right)× P\left(\mathrm{B/A}\right)P\left(A\cap B\right)=P(A)× P(B)$$
$$P\left(A\cap B\right)=P\left(B\right)× P\left(\mathrm{A/B}\right)P\left(A\cap B\right)=P(B)× P(A)$$
Therefore, you can find the intersection of the two independents by multiplying the probability of those two events.
$$P\left(A\cap B\right)=P\left(A\right)× P\left(B\right)=P(B)× P(A)$$
Given that events A and B are independent let's determine the probability that the first student you select for the interview will be from the business faculty and be an international student.
$$P\left(A\cap B\right)=P\left(A\right)× P\left(B\right)=0.6× 0.3=0.18$$
Union of events
The union of two events produces another event that contains all elements from either or both events. The word "OR" is typically used to describe the union of two events.
In Example 1, the union of events A and B means selecting an international student or a student from the business faculty. This can be denoted as follows.
$$A\cup B$$
Let's show the union of events A and B in a Venn diagram.
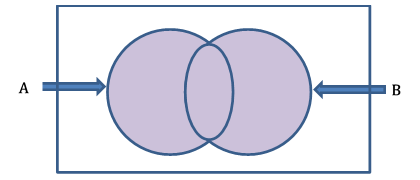
The above Venn diagram colored area represents the union of events A and B.
To calculate the probability of event A or event B, we must add the probabilities of both events and subtract the probability of the intersection.
The probability of a union of events A and B can be written as follows.
$$P\left(A\cup B\right)=P\left(A\right)+P\left(B\right)-P\left(A\cap B\right)$$
We can modify the above formula and create a new formula to find the probability of the union of two independent events when the probability of the intersection of two events is unknown and the two events are independent.
If the events are independent,
$$P\left(A\cap B\right)=P(A)× P(B)$$
Therefore,
$$P\left(A\cup B\right)=P\left(A\right)+P\left(B\right)-P(A)× P(B)$$
Let's calculate what would be the probability of combining events A and B, that is, with what probability would we choose a student who is a business major, an international student, or both at the same time?
$$P(A\cup B)=P(A)+P(B)-P(A\cap B)=0.6+0.3-0.18=0.72$$
Thanks to the Probability of Two Events Calculator or Probability Solver for Two Events Calculator, you can complete all the calculations above quickly. You can use the Probability Solver for Two Events Calculator even if you would like to check your probability calculation steps because it also displays the steps for the calculation.
Normal distribution
The normal distribution is symmetrical and has a bell shape. A normal distribution has an identical mean, median, and mode as well as 50% of the data above the mean and 50% below the mean. The normal distribution curve goes away from the mean in both directions but never touches the X-axis. The total area under the curve is 1.
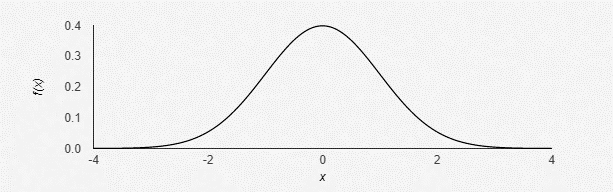
If random variable X has a normal distribution with parameters μ and σ2, we write X ~ N(μ, σ²).
Probability of normal distribution
A normal distribution's probability density function is depicted below:
$$f\left(x\right)=\frac{1}{\sqrt{2π\sigma^2}}× e^\frac{-{(x-\mu)}^2}{2\sigma^2}$$
In this function:
- μ is the mean of the distribution;
- σ² is the variance of the distribution;
- π is 3.14;
- e is 2.7182.
It is impossible to provide a probability table for each combination of mean and standard deviation because there are an infinite number of different normal curves. The standard normal distribution is utilized as a result. The normal distribution with a mean of 0 and a standard deviation of 1 is referred to as the standard normal distribution.
To calculate the probability of a normal distribution, we must first transform the actual distribution into a standard normal distribution using the z-score and then use the z-table to calculate the probability. The normal probability calculator functions as a standard normal probability calculator by offering probabilities for various confidence levels.
$$Z=\frac{X-\mu}{\sigma}$$
The standard normal distribution curve can be used to resolve a variety of real world problems. To determine the probability of continuous variables, the normal distribution is utilized. A continuous variable is a variable that can assume any number of values, even a decimal. A few examples of continuous variables are height, weight, and temperature.
Let's learn how to find the probability of normal distribution using the below example.
Example
Your batch's statistics course results are normally distributed, with a mean of 65 and a standard deviation of 10. Determine the probability of the following scenarios if a student is selected at random:
- the student's score is equal or above 70,
- the student's score is less than 70,
- the student's score is between 50 and 70.
Solution
$$P\left(X≥70\right)=P\left(Z≥\frac{70-65}{10}\right)=P\left(Z≥0.5\right)=1-0.6915=0.3085$$
$$P\left(X<70\right)=P\left(Z<\frac{70-65}{10}\right)=P\left(Z<0.5\right)=0.6915$$
$$P\left(50>X>70\right)=P\left(\frac{50-65}{10}>Z>\frac{70-65}{10}\right)=P\left(1.5>Z>0.5\right)=0.4332+0.1915=0.6247$$
Computing the probability of a normal curve involves numerous steps and requires using z-tables. On the other hand, the normal distribution probability calculator helps you compute probability simply by entering four numbers into the calculator. To use the normal distribution calculator, you only need to enter the mean, standard deviation, and left and right boundaries.