No results found
We can’t find anything with that term at the moment, try searching something else.
Z-Score Calculator
The Z-Score Calculator helps to get the z-score of a normal distribution, convert between z-score and probability, and get the probability between 2 z-scores.
| Result | ||
|---|---|---|
| Z-score | 1 | |
| Probability of x<5 | 0.84134 | |
| Probability of x>5 | 0.15866 | |
| Probability of 3<x<5 | 0.34134 | |
| Result | ||
|---|---|---|
| Z-score | 2 | |
| P(x<Z) | 0.97725 | |
| P(x>Z) | 0.02275 | |
| P(0<x<Z) | 0.47725 | |
| P(-Z<x<Z) | 0.9545 | |
| P(x<-Z or x>Z) | 0.0455 | |
| Result | ||
|---|---|---|
| P(-1<x<0) | 0.34134 | |
| P(x<-1 or x>0) | 0.65866 | |
| P(x<-1) | 0.15866 | |
| P(x>0) | 0.5 | |
There was an error with your calculation.
Table of Contents
- What is z-score?
- The Z- Score formula
- Interpretation of the results of the obtained Z-score
- Z-score and standard deviation
- Z-score and the normal distribution
- Comparison of data points
- Data normalization
- Hypothesis testing
- Feature scaling
- Predictive modeling
- Using the Z score table
- Finding the probability from Z-score
- Finding the Corresponding Values for the Specified Probability

Z-Score Calculator can be used for any type of Z-Score-related calculations. You can enter a raw score (X), Population mean ( μ), and Standard Deviation (σ) in the first calculator to find the Z-Score with steps and related probabilities to that row score.
The Z-score and Probability Converter helps you to convert between Z-Scores and probabilities without referencing a Z-table. The results will include all possible probability calculations with that single z score. Use the last calculator to find the probability between 2 Z-Scores.
What is z-score?
Z-score is a statistical measure that describes the number of standard deviations of a data point from the mean of a data set. The Z-score is used to compare a single data point to the entire data set and helps to standardize the data so that it is easier to compare and analyze.
The Z-score allows us to determine how "typical" or conversely "atypical" a single data point is compared to the entire data set.
- Detect outliers: Z-scores can help us identify data points that are significantly different from the rest of the data. This is useful in areas such as finance and medical research, where outliers can indicate important patterns or anomalies.
- Compare data from different sets: Z-score allows us to compare data from different sets, even if they have different units or ranges. This is useful in areas such as machine learning, where you need to compare data from different sources to build models.
- Normalize data: By converting data into Z-scores, we can standardize data and make it easier to compare and analyze. This is useful in areas such as data visualization, where we need to present data in an understandable way.
The Z- Score formula
The Z Score for a population
Z = Raw score - Population Mean / Population Standard Deviation
Z = (X - μ) / σ
The Z Score for a sample
Z = Raw score - Sample Mean / Sample Standard Deviation
Z = (X - x̄) / s
Interpretation of the results of the obtained Z-score
Positive Z-score: A positive Z-score means that your data point is above the average value of the dataset. In other words, your observed data point is higher than the typical value in the dataset.
Negative Z-score: A negative Z-score means that your data point is below the average value of the dataset. In other words, your observed data point is lower than the typical value in the dataset.
Z-score: The Z-score tells you how far your data point is from the dataset average. The larger the Z-score, the farther your observed data point is from the average value.
Z-score and standard deviation
Z-score and standard deviation are related because the standard deviation is used to calculate the Z-score. In fact, the standard deviation is a key component of the Z-score formula.
The standard deviation is a measure of the spread of the data set. It shows how far each data point is from the average value of the data set. The greater the standard deviation, the greater the dispersion of the data.
The Z-score, on the other hand, tells you how far one data point is from the mean of the data set relative to the standard deviation. By using the standard deviation to calculate the Z-score, you can compare one data point to the entire data set and see how unusual or typical it is.
Z-score and the normal distribution
The normal distribution is a type of distribution that is often found in many real-world phenomena. It is a bell-shaped curve that represents the distribution of data around the mean of a set of data. The normal distribution is also known as the Gaussian distribution, after the mathematician Carl Friedrich Gauss.
The Z-score is a way of measuring how far one data point is from the mean of a data set relative to the standard deviation. By converting each data point to a Z-score, you can compare an individual data point to the entire data set and see how unusual or typical it is.
The connection between a Z-score and a normal distribution is that the Z-score can be used to standardize the data and conform it to a normal distribution. This means that you can convert any data set to a normal distribution by converting each data point to a Z-score. This is useful because many statistical methods assume that the data are normally distributed, so converting the data to a normal distribution can help you use these methods more accurately.
Comparison of data points
Z-score can help you understand how far one data point is from the mean of a data set relative to the standard deviation.
Our example of using Z-score to compare data points applies to finance. For example, you have invested in two different stock portfolios and want to compare their performance. Portfolio A's average return is 10% with a standard deviation of 2%, and portfolio B's average return is 8% with a standard deviation of 3%. By converting the returns into Z-scores, you can compare the returns of each portfolio and determine which one performs better.
Another practical example of using Z-score to compare data points is sports. For example, you want to compare the performance of two basketball players, player A and player B. Player A scores an average of 20 points per game for a standard deviation of 5 points, and player B scores an average of 18 points per game for a standard deviation of 3 points. By converting the scores to Z-score, you can compare each player's performance and determine which player is performing better.
Data normalization
Data normalization is the process of converting data to a standard scale so that it can be easily compared and analyzed. This is important because data can have different shapes and scales, and normalizing data ensures that it is on the same scale and makes it easier to compare and analyze.
By converting each data point to a Z-score, you can standardize the data and put it on the same scale. This is because the Z-score is always on a standard scale, where the mean is 0 and the standard deviation is 1.
One practical example of using Z-score to normalize data relates to the field of psychology. For example, you want to compare the results of two IQ tests, Test A and Test B. Test A has a mean score of 100 with a standard deviation of 15, and test B has a mean score of 110 with a standard deviation of 10. By converting the scores to Z-score, the scores can be standardized and reduced to a single scale, which facilitates comparison and analysis.
Another practical example of using Z-score to normalize data is in education. For example, you want to compare the grades of two students, student A and student B. Student A has an average grade of 80 with a standard deviation of 5, and student B has an average grade of 90 with a standard deviation of 3. By converting the grades into Z-coefficients, you can standardize the grades and make them all on the same scale, which makes comparison and analysis easier.
Hypothesis testing
Hypothesis testing is a statistical technique used to determine whether there is enough evidence to reject the null hypothesis, or the standard assumption that there is no relationship between two variables. It is important in many fields, including medical research, social science, and business, where making informed decisions based on data is critical.
When testing hypotheses, Z-coefficients can be used to determine the probability of a particular outcome occurring. For example, you might test whether the average weight of a group of people differs from the average weight of the entire population. You can use the Z-score to determine if the difference is statistically significant.
One practical example of using the Z-score to test hypotheses is in the medical field. For example, you want to test whether a new medicine is effective in reducing the symptoms of a certain disease. You can use the Z-score to determine whether the difference in symptoms between the group taking the drug and the control group is statistically significant.
Another practical example of using the Z-score to test hypotheses is in the area of finance. For example, you want to test whether a particular stock has a higher return than the average stock in the market. You can use the Z-score to determine whether the difference in returns is statistically significant.
Feature scaling
Feature scaling is a technique used in machine learning and other data analysis applications to ensure that all the features in a dataset have the same scale. This is important because some machine learning algorithms are sensitive to the scale of the data and can produce inaccurate results if the scale does not match.
One common method of scaling traits is Z-score normalization, also known as standardization. In this process, each trait is converted so that its mean value is 0 and its standard deviation is 1. The formula for calculating a trait's Z-score is as follows:
Z = (X - Mean) / Standard Deviation
where X is the value of the feature, Mean is the mean of the feature, and Standard Deviation is the Standard Deviation of the feature.
A practical example of using Z-score to scale features is in the field of computer vision. When working with image data, it is usually required to scale pixel values so that they are in the range of 0 to 1. This can be achieved by normalizing the Z-score, since each pixel value can be transformed so that its mean value is 0, and its standard deviation is 1.
Another practical example of using Z-score for feature scaling is natural language processing. When working with textual data, it is common practice to scale term frequency and inverse document frequency (TF-IDF) values so that they are in the range of 0 to 1. This can also be achieved by using Z-score normalization.
Predictive modeling
Predictive modeling is a technique used in machine learning and other data analysis applications to make predictions based on historical data. It involves training a model on a data set and using that model to make predictions on new, unseen data.
One important aspect of predictive modeling is feature selection, which involves selecting the most relevant features from the data set for use in the model. Often, traits that are highly correlated with the target variable are preferred because they are more likely to predict the target variable.
The Z-score can be used to identify traits that are highly correlated with the target variable because traits that have a high Z-score are more likely to predict the target variable. The formula for calculating a trait's Z-score is as follows:
Z = (X - Mean) / Standard Deviation
where X is the value of the feature, Mean is the mean of the feature, and Standard Deviation is the Standard Deviation of the feature.
A practical example of using Z-score in prognostic modeling belongs to the field of finance. When predicting stock prices the Z-score of the stock's past performance can be used for determining its future return potential. A high Z-score indicates that a stock's past return is well above average and can be projected for higher returns in the future.
Another practical example of using the Z-score in predictive modeling is in the health care field. When predicting patient outcomes, the Z-score can be used to determine a patient's potential for future outcomes. A high Z-score indicates that a patient's health outcomes are significantly worse than the average and may indicate poor future outcomes.
Using the Z score table
A z-table, also known as a standard normal table or unit normal table, is a table that contains standardized values used to calculate the probability of a given statistic falling below, above, or between the standard normal distribution.
| z | 0 | 0.01 | 0.02 | 0.03 | 0.04 | 0.05 | 0.06 | 0.07 | 0.08 | 0.09 |
|---|---|---|---|---|---|---|---|---|---|---|
| 0 | 0 | 0.00399 | 0.00798 | 0.01197 | 0.01595 | 0.01994 | 0.02392 | 0.0279 | 0.03188 | 0.03586 |
| 0.1 | 0.03983 | 0.0438 | 0.04776 | 0.05172 | 0.05567 | 0.05962 | 0.06356 | 0.06749 | 0.07142 | 0.07535 |
| 0.2 | 0.07926 | 0.08317 | 0.08706 | 0.09095 | 0.09483 | 0.09871 | 0.10257 | 0.10642 | 0.11026 | 0.11409 |
| 0.3 | 0.11791 | 0.12172 | 0.12552 | 0.1293 | 0.13307 | 0.13683 | 0.14058 | 0.14431 | 0.14803 | 0.15173 |
| 0.4 | 0.15542 | 0.1591 | 0.16276 | 0.1664 | 0.17003 | 0.17364 | 0.17724 | 0.18082 | 0.18439 | 0.18793 |
| 0.5 | 0.19146 | 0.19497 | 0.19847 | 0.20194 | 0.2054 | 0.20884 | 0.21226 | 0.21566 | 0.21904 | 0.2224 |
| 0.6 | 0.22575 | 0.22907 | 0.23237 | 0.23565 | 0.23891 | 0.24215 | 0.24537 | 0.24857 | 0.25175 | 0.2549 |
| 0.7 | 0.25804 | 0.26115 | 0.26424 | 0.2673 | 0.27035 | 0.27337 | 0.27637 | 0.27935 | 0.2823 | 0.28524 |
| 0.8 | 0.28814 | 0.29103 | 0.29389 | 0.29673 | 0.29955 | 0.30234 | 0.30511 | 0.30785 | 0.31057 | 0.31327 |
| 0.9 | 0.31594 | 0.31859 | 0.32121 | 0.32381 | 0.32639 | 0.32894 | 0.33147 | 0.33398 | 0.33646 | 0.33891 |
| 1 | 0.34134 | 0.34375 | 0.34614 | 0.34849 | 0.35083 | 0.35314 | 0.35543 | 0.35769 | 0.35993 | 0.36214 |
| 1.1 | 0.36433 | 0.3665 | 0.36864 | 0.37076 | 0.37286 | 0.37493 | 0.37698 | 0.379 | 0.381 | 0.38298 |
| 1.2 | 0.38493 | 0.38686 | 0.38877 | 0.39065 | 0.39251 | 0.39435 | 0.39617 | 0.39796 | 0.39973 | 0.40147 |
| 1.3 | 0.4032 | 0.4049 | 0.40658 | 0.40824 | 0.40988 | 0.41149 | 0.41308 | 0.41466 | 0.41621 | 0.41774 |
| 1.4 | 0.41924 | 0.42073 | 0.4222 | 0.42364 | 0.42507 | 0.42647 | 0.42785 | 0.42922 | 0.43056 | 0.43189 |
| 1.5 | 0.43319 | 0.43448 | 0.43574 | 0.43699 | 0.43822 | 0.43943 | 0.44062 | 0.44179 | 0.44295 | 0.44408 |
| 1.6 | 0.4452 | 0.4463 | 0.44738 | 0.44845 | 0.4495 | 0.45053 | 0.45154 | 0.45254 | 0.45352 | 0.45449 |
| 1.7 | 0.45543 | 0.45637 | 0.45728 | 0.45818 | 0.45907 | 0.45994 | 0.4608 | 0.46164 | 0.46246 | 0.46327 |
| 1.8 | 0.46407 | 0.46485 | 0.46562 | 0.46638 | 0.46712 | 0.46784 | 0.46856 | 0.46926 | 0.46995 | 0.47062 |
| 1.9 | 0.47128 | 0.47193 | 0.47257 | 0.4732 | 0.47381 | 0.47441 | 0.475 | 0.47558 | 0.47615 | 0.4767 |
| 2 | 0.47725 | 0.47778 | 0.47831 | 0.47882 | 0.47932 | 0.47982 | 0.4803 | 0.48077 | 0.48124 | 0.48169 |
| 2.1 | 0.48214 | 0.48257 | 0.483 | 0.48341 | 0.48382 | 0.48422 | 0.48461 | 0.485 | 0.48537 | 0.48574 |
| 2.2 | 0.4861 | 0.48645 | 0.48679 | 0.48713 | 0.48745 | 0.48778 | 0.48809 | 0.4884 | 0.4887 | 0.48899 |
| 2.3 | 0.48928 | 0.48956 | 0.48983 | 0.4901 | 0.49036 | 0.49061 | 0.49086 | 0.49111 | 0.49134 | 0.49158 |
| 2.4 | 0.4918 | 0.49202 | 0.49224 | 0.49245 | 0.49266 | 0.49286 | 0.49305 | 0.49324 | 0.49343 | 0.49361 |
| 2.5 | 0.49379 | 0.49396 | 0.49413 | 0.4943 | 0.49446 | 0.49461 | 0.49477 | 0.49492 | 0.49506 | 0.4952 |
| 2.6 | 0.49534 | 0.49547 | 0.4956 | 0.49573 | 0.49585 | 0.49598 | 0.49609 | 0.49621 | 0.49632 | 0.49643 |
| 2.7 | 0.49653 | 0.49664 | 0.49674 | 0.49683 | 0.49693 | 0.49702 | 0.49711 | 0.4972 | 0.49728 | 0.49736 |
| 2.8 | 0.49744 | 0.49752 | 0.4976 | 0.49767 | 0.49774 | 0.49781 | 0.49788 | 0.49795 | 0.49801 | 0.49807 |
| 2.9 | 0.49813 | 0.49819 | 0.49825 | 0.49831 | 0.49836 | 0.49841 | 0.49846 | 0.49851 | 0.49856 | 0.49861 |
| 3 | 0.49865 | 0.49869 | 0.49874 | 0.49878 | 0.49882 | 0.49886 | 0.49889 | 0.49893 | 0.49896 | 0.499 |
| 3.1 | 0.49903 | 0.49906 | 0.4991 | 0.49913 | 0.49916 | 0.49918 | 0.49921 | 0.49924 | 0.49926 | 0.49929 |
| 3.2 | 0.49931 | 0.49934 | 0.49936 | 0.49938 | 0.4994 | 0.49942 | 0.49944 | 0.49946 | 0.49948 | 0.4995 |
| 3.3 | 0.49952 | 0.49953 | 0.49955 | 0.49957 | 0.49958 | 0.4996 | 0.49961 | 0.49962 | 0.49964 | 0.49965 |
| 3.4 | 0.49966 | 0.49968 | 0.49969 | 0.4997 | 0.49971 | 0.49972 | 0.49973 | 0.49974 | 0.49975 | 0.49976 |
| 3.5 | 0.49977 | 0.49978 | 0.49978 | 0.49979 | 0.4998 | 0.49981 | 0.49981 | 0.49982 | 0.49983 | 0.49983 |
| 3.6 | 0.49984 | 0.49985 | 0.49985 | 0.49986 | 0.49986 | 0.49987 | 0.49987 | 0.49988 | 0.49988 | 0.49989 |
| 3.7 | 0.49989 | 0.4999 | 0.4999 | 0.4999 | 0.49991 | 0.49991 | 0.49992 | 0.49992 | 0.49992 | 0.49992 |
| 3.8 | 0.49993 | 0.49993 | 0.49993 | 0.49994 | 0.49994 | 0.49994 | 0.49994 | 0.49995 | 0.49995 | 0.49995 |
| 3.9 | 0.49995 | 0.49995 | 0.49996 | 0.49996 | 0.49996 | 0.49996 | 0.49996 | 0.49996 | 0.49997 | 0.49997 |
| 4 | 0.49997 | 0.49997 | 0.49997 | 0.49997 | 0.49997 | 0.49997 | 0.49998 | 0.49998 | 0.49998 | 0.49998 |
To use the z-table, you need to find the row that corresponds to your calculated z-score and then locate the corresponding column that gives you the area (probability) under the standard normal curve. The resulting value is the approximate probability that a random variable from a standard normal distribution will be less than or equal to your calculated z-score.
For example, if you have a z-score of 1.96, you would look in the z-table for the row that corresponds to 1.9 and the column that corresponds to 0.06. The resulting value would give you the area under the standard normal curve to the right of 1.96. This value is approximately 0.975, meaning that approximately 97.5% of the data from a standard normal distribution would be less than or equal to 1.96.
It's important to note that the z-table only works for a standard normal distribution with a mean of 0 and a standard deviation of 1. If your data does not follow this distribution, you will need to standardize it first by transforming the data into z-scores.
Finding the probability from Z-score
When we convert a normally distributed variable into a z-score, we can use the Z-score table and find the proportion of area under the normal curve. The total area under the standard normal curve is equal to 1. Therefore, the proportion of area covered in a normal curve equals the probability of that Z-score.
Example 1
The weights of boxing players are normally distributed with a mean of 75 Kg and a standard deviation of 3 Kg. What is the probability that the weight of a randomly selected player is;
- a) More than 78 Kg?
- b) Less than 69 Kg?
- c) More than 72 Kg?
- d) Less than 79.5 Kg?
- e) Between 72 Kg and 76.5 Kg?
- f) Between 72 Kg and 73.5 Kg?
a) What is the probability that a randomly selected player weighs more than 78 kg?
- X > 78
- μ = 75
- σ = 3
$$P(X>78)=P\left(Z>\frac{X-μ}{σ}\right)=P\left(Z>\frac{78-75}{3}\right)=P(Z>1)$$
First, we will draw this in a Z curve.
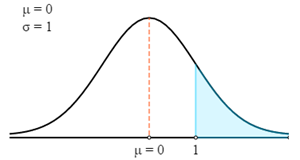
Now we will use Z-Table to find the relevant probability for the calculated Z-Score.
Remember that Z-Score always gives the probability between the Z-score and the mean. To get the probability of the highlighted area in the graph, we need to reduce that probability from 0.5. (Total probability under the curve is 1, and the Mean of the standard distribution equally segregates into 2 parts. Hence, the probability from the Mean point to either side of the end is 0.5.)
- P (X > 78) = P (Z > 1)
- P (X > 78) = 0.5 - P(0 < Z < 1)
- P (X > 78) = 0.5 - 0.3413
- P (X > 78) = 0.1587
Therefore, there is a 0.1587 probability that the weight of a randomly selected player is more than 78 Kg.
b) What is the probability that a randomly selected player weighs less than 69 kg?
- X < 69
- μ = 75
- σ = 3
$$P(X<69)=P\left(Z>\frac{X-μ}{σ}\right)=P\left(Z>\frac{69-75}{3}\right)=P(Z<-2)$$
First, we will draw this in a Z curve.
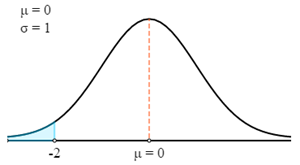
Now we will use Z-Table to find the relevant probability for the calculated Z-Score.
Remember that Z-Score always gives the probability between the Z-score and the mean. To get the probability of the highlighted area in the graph, we need to reduce that probability from 0.5.
- P (X < 69) = P (Z < 69)
- P (X < 69) = 0.5 - P (0 > Z > -2)
- P (X < 69) = 0.5 - 0.4772
- P (X < 69) = 0.0228
Therefore, there is a 0.0228 probability that the weight of a randomly selected player is less than 69 Kg.
c) What is the probability that a randomly selected player's weight is between 72 kg and 76.5 kg?
- 72 < X < 76.5
- μ = 75
- σ = 3
$$P(72 \lt X \lt 76.5)=P\left(\frac{X-μ}{σ} \lt Z \lt \frac{X-μ}{σ}\right)=P\left(\frac{72-75}{3} \lt Z \lt \frac{76.5-75}{3}\right)=P(-1 \lt Z \lt 0.5)$$
First, we will draw this in a Z curve.
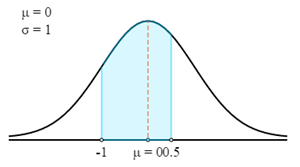
Now we will use Z-Table to find the relevant probability for the calculated Z-Score.
Remember that Z-Score always gives the probability between the Z-score and the mean. To get the probability of the highlighted area in the graph, you can add the probabilities of 2 Z-scores together.
- P (72 < X < 76.5) = P (-1 < Z < 0.5)
- P (72 < X < 76.5) = 0.3413 + 0.1915
- P (72 < X < 76.5) = 0.5328
Therefore, there is a 0.5328 probability that the weight of a randomly selected player is between 72 Kg and 76.5 Kg.
In this case, you have to use the Probability between Two Z-scores calculator to find the answer quickly.
Finding the Corresponding Values for the Specified Probability
When we know that the distribution is normal, we can find the corresponding values for specified probabilities based on Z-Score.
Example 2
Applicants' marks on a competitive exam are approximately normally distributed, with a mean of 55 and a standard deviation of 10. If the top 30% of applicants pass the test, find the minimum passing score.
Solution
In this case, we first have to find the corresponding Z-score for the given probability or percentage.
To find the Z-Score, we actually need to find the probability in the highlighted area.
It is obtained by deducting 0.30 from 0.50. Therefore, the probability of the highlighted area is 0.20.
Now, in the Z-table, we have to find the closest probability to 0.20. The corresponding Z-Score is 0.524.
Then, we have to find the X value using the Z-Score formula.
- Z = (X - μ)/σ
- 0.524 = (X - 55)/10
- X = (0.524 × 10) + 55
- X = 60.24
Therefore, the minimum passing score for the exam is 60.24.